Navigate to Reporting > Trunk Analytics.
This report allows administrators the ability to view all inbound and outbound call information for individual trunks. This report is particularly useful for viewing call data at a high level across multiple Ring Groups and agents.
Main Menu:
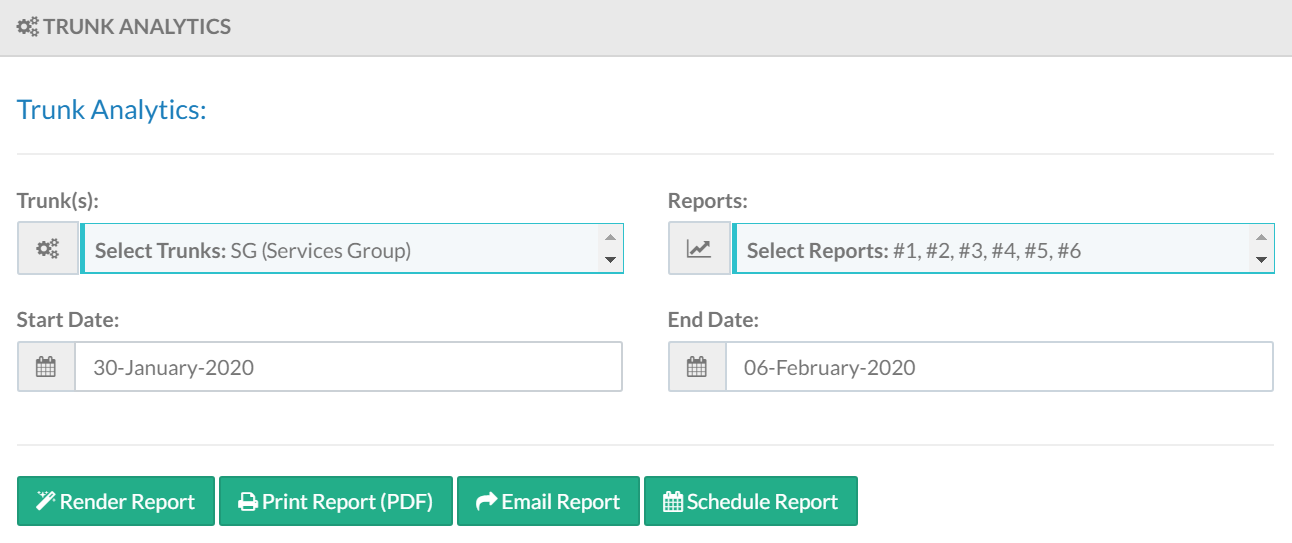
To run a report, select the desired Trunk(s) and corresponding Reports.

Populate a Start Date and End Date for the report.

Click Render Report once search criteria is populated.

Report results are displayed on screen for each selected report. Export to CSV is available at the top of each individual report as well.
Trunk Analytic Reports
There are six available reports within the Trunk Analytics menu. Select desired reports(s) or click Select All Reports to return all available data.
- Concurrent Calls
- Total Call Traffic (Hourly)
- Total Call Traffic (Daily)
- Total Call Traffic (Monthly)
- Number Frequency
- Trunk Call Details
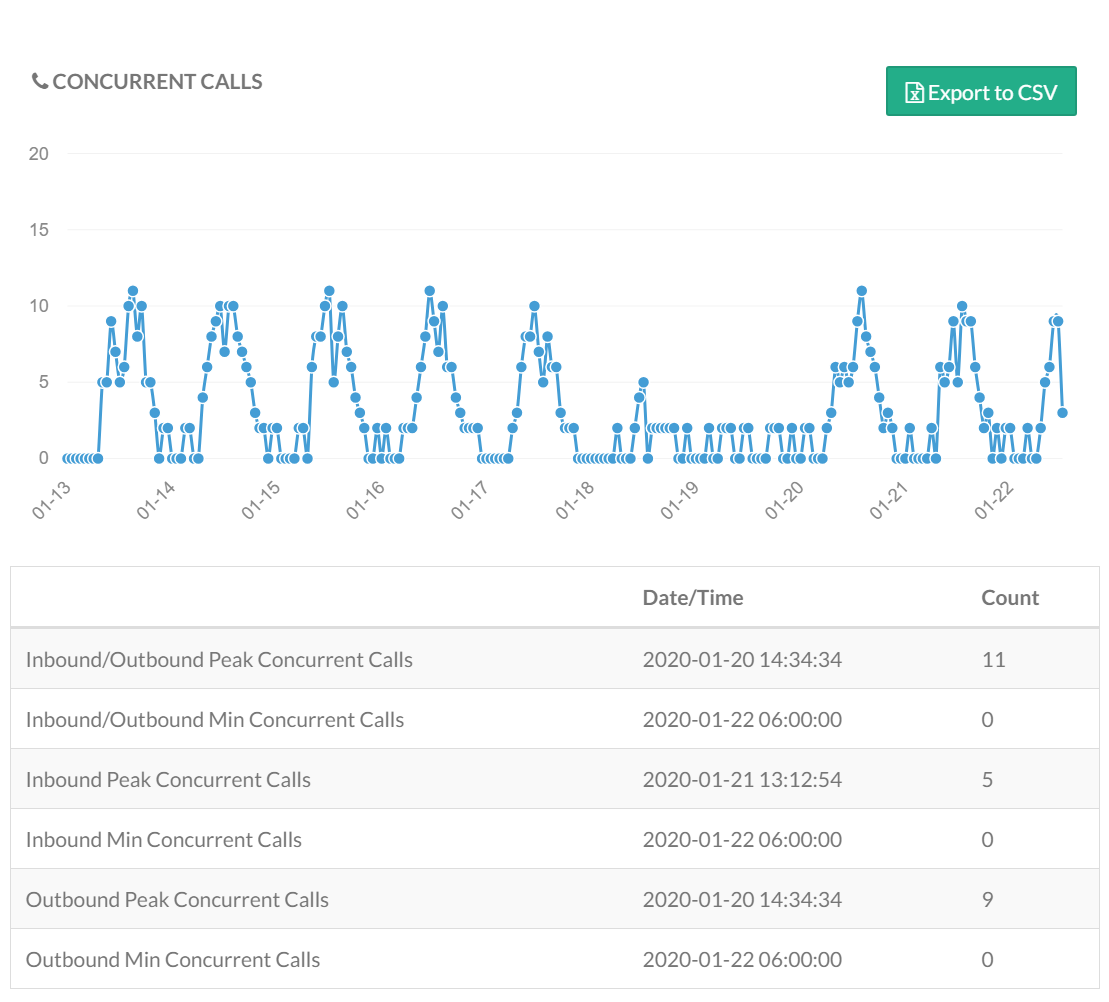
Concurrent Calls
This report displays the maximum amount of calls that occurred simultaneously including Ring Group calls on hold or waiting to be answered. Note: Extension to extension calls are using the same trunk and therefore do not count as a concurrent call.
The graph displays concurrent call trends per day include the maximum amount of simultaneous active. This report also displays an additional table detailing the maximum concurrent calls (inbound and outbound).
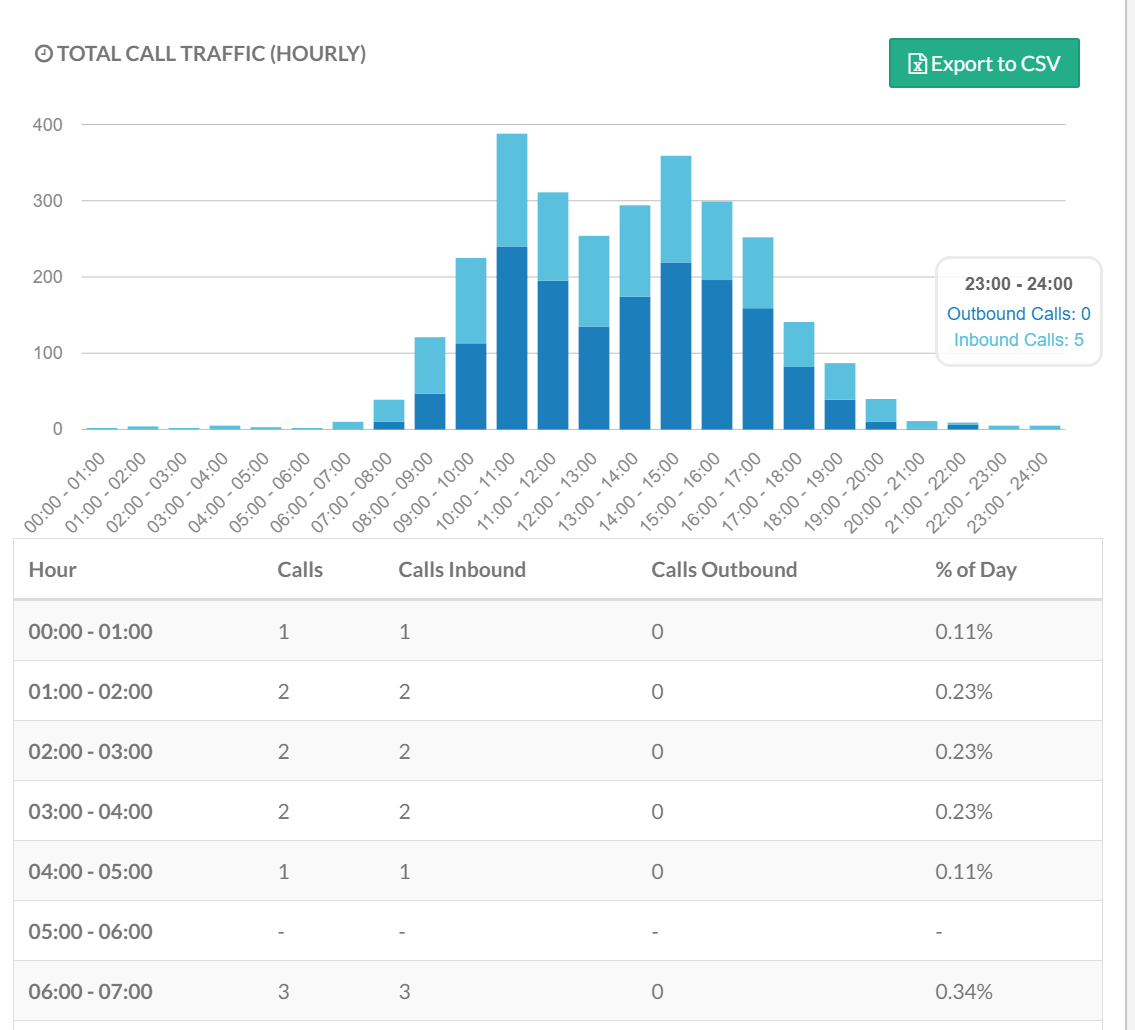
Total Call Traffic (Hourly)
This report shows the number of inbound and outbound calls during any one hour period of the day. Inbound calls appear in dark blue, while outbound calls display in light blue. Hovering the mouse over any particular bar in the graph will show the number of both inbound and outbound calls for that hour.
Below the bar chart is a table of additional information broken down by hour. This table lists the total calls, inbound calls, outbound calls, and what percentage of total calls were taken during the period.
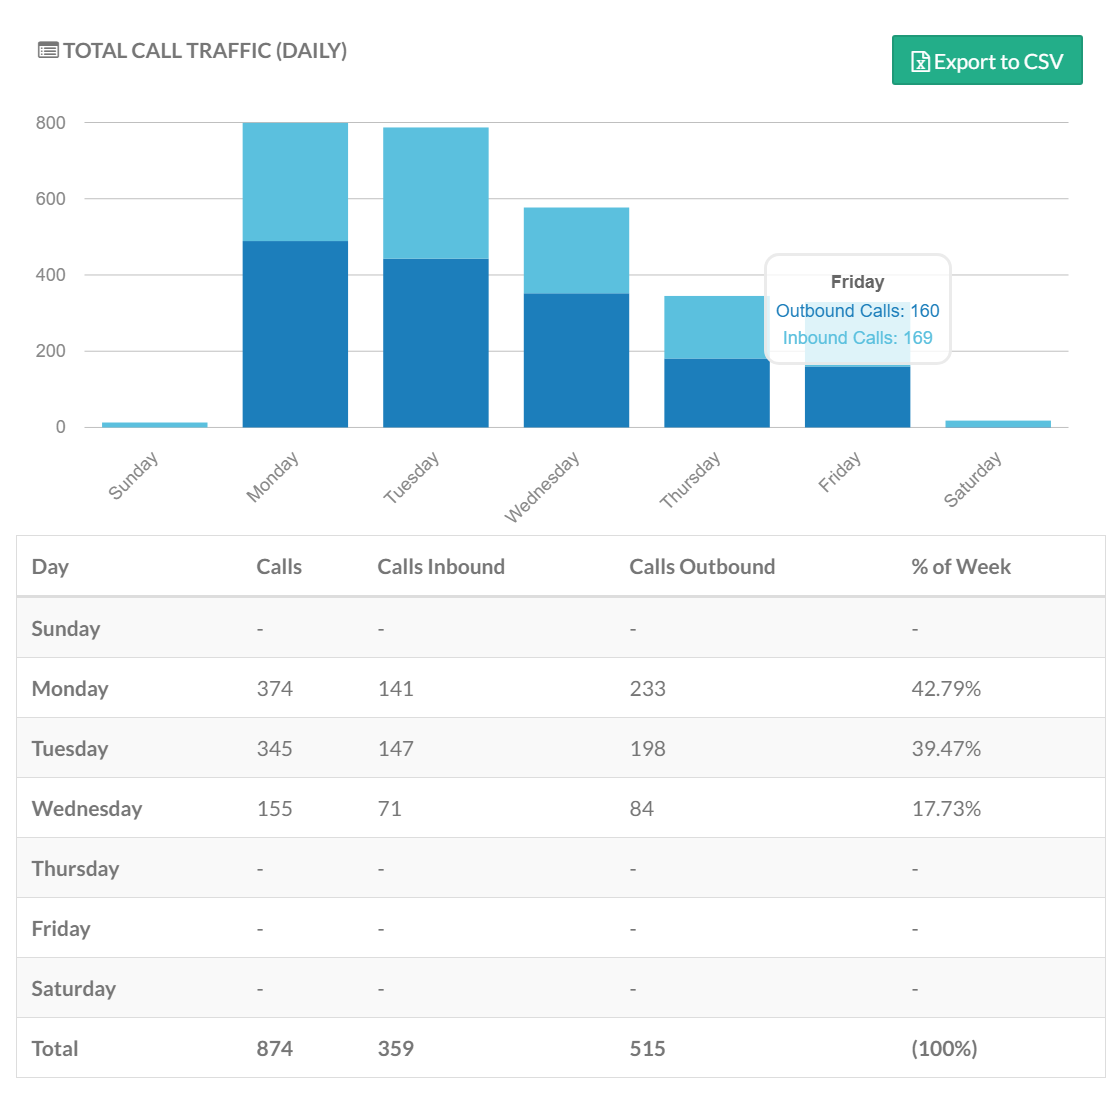
Total Call Traffic (Daily)
This report shows the same data as the Total Call Traffic Hourly Report but displays calls by day of the week. Hovering the mouse over any particular bar in the graph shows the number of daily calls.
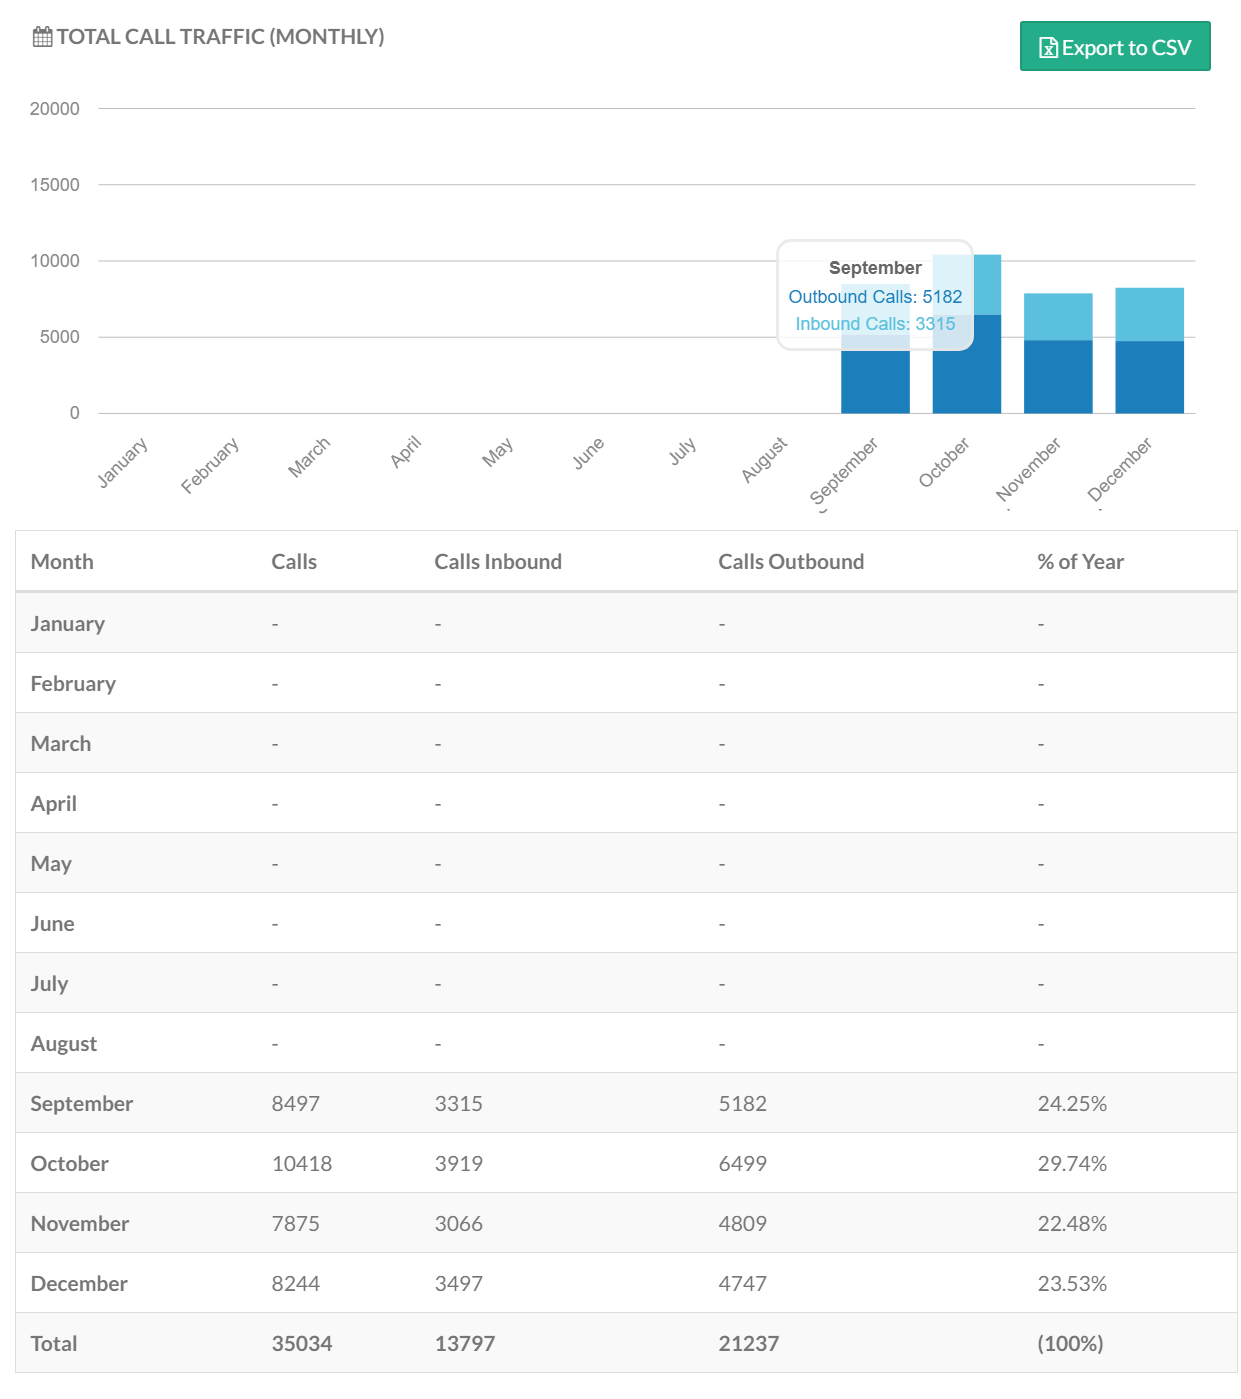
Total Call Traffic (Monthly)
This report shows the same data as the Total Call Traffic Daily Report but displays calls by month. Hovering the mouse over any particular bar in the graph shows the number of monthly calls.
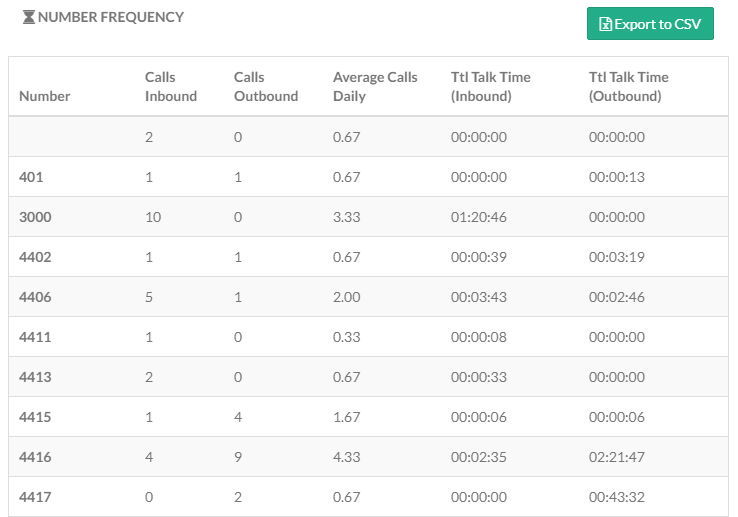
Number Frequency
This report displays numbers along with corresponding number of inbound and outbound calls, average calls per day, total talk time both inbound and outbound.
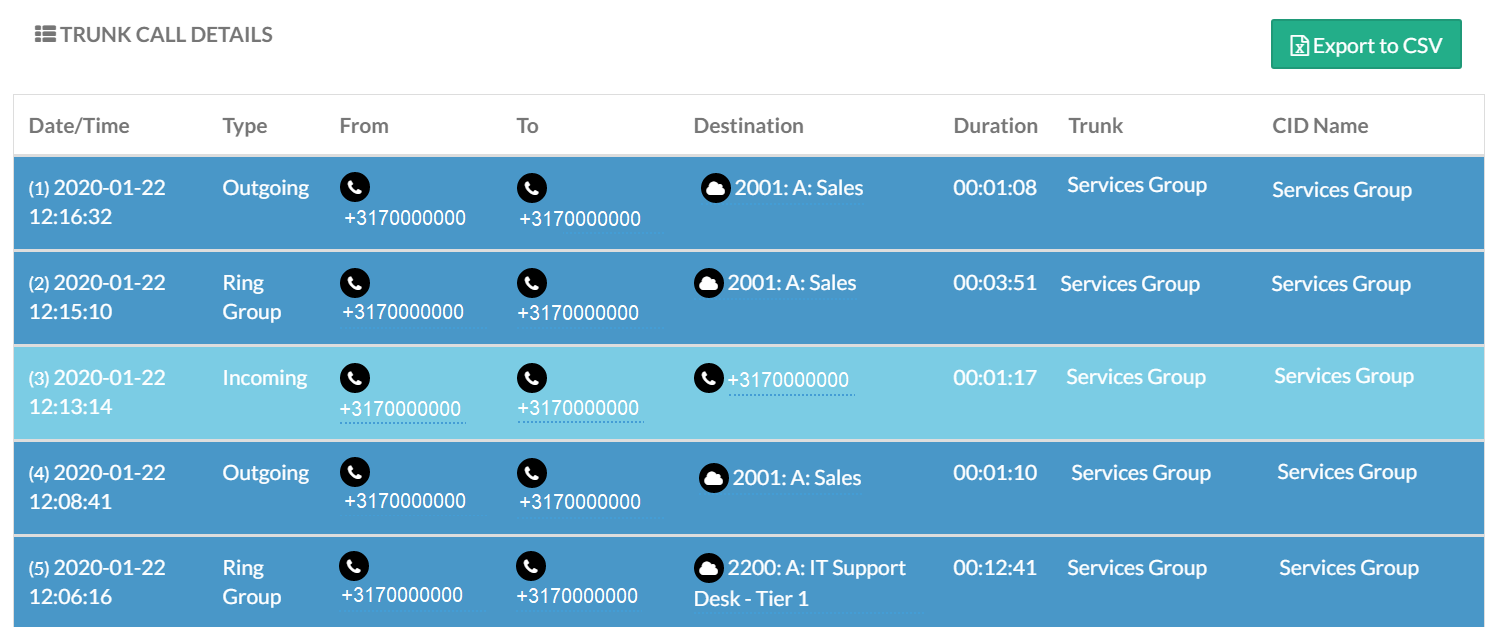
Trunk Call Details
This report shows all available CDRs for the selected Trunk(s). The report includes typical CDR data including date/time of call, duration, and Caller ID info.