The System Health menus display all relevant information about the current status of the Kerauno server and also give administrators access to maintenance and system log information.
System Health Dashboard
From the System Settings sidebar, click the System Health menu to display the main System Health Dashboard screen. This dashboard shows important metrics on how the Kerauno hardware is functioning as well as some statistics about the Kerauno current configuration.
At the top of the screen, the number of departments, users, extensions, and devices that are currently built into Kerauno are listed. This data is pulled from the respective menus under the Users & Devices tab.
 Figure 01: System Health Dashboard Statistics
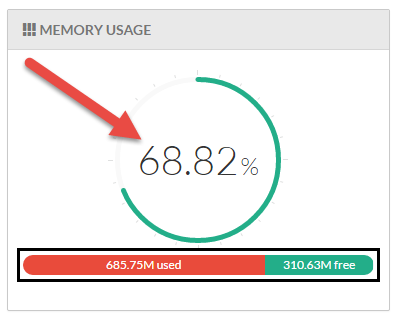
Also listed on this screen are a variety of charts describing the current utilization rates of various resources on Kerauno. Each section is listed with a percentage chart that shows the total percent of current usage and a bar with exact details about the amount of resources being used (refer to Figure 02 for an example). |
|
Detailed statistics about the following system resources are displayed on this page:
CPU Usage: Monitors the amount of CPU processing power currently being utilized by the Kerauno server. The circle graph shows the percentage of total CPU currently being used, while the bar graph shows both used and unused CPU percentage.
Memory Usage: Monitors the amount of open system memory, or RAM, that is available on the Kerauno server. The circle graph shows the percentage of total memory that is currently being used, while the bar graph shows the amount of used and free RAM in megabytes (MB) or gigabytes (GB).
Storage: Monitors the amount of hard disk space that is currently being used by the Kerauno server. This value encompasses basic data including configurations, device information, backups, etc. The circle graph shows the percentage of total hard disk space that is currently being used, while the bar graph shows the amount of used or free hard disk space in MB or GB.
Log Storage: Monitors the amount of hard disk space that is currently being used by the Kerauno server. The Log Storage value encompasses Kerauno data including: administrator logs, error logs, and call recordings. The circle graph shows the percentage of total log space that is currently being used while the bar graph shows the amount of used or free log space in MB or GB.
Swap Usage: Monitors the amount of swap memory (virtual memory on the hard disk) that is currently being used. The circle graph shows the percentage of swap memory that is currently being used, while the bar graph shows the amount of used or free swap memory in MB or GB.
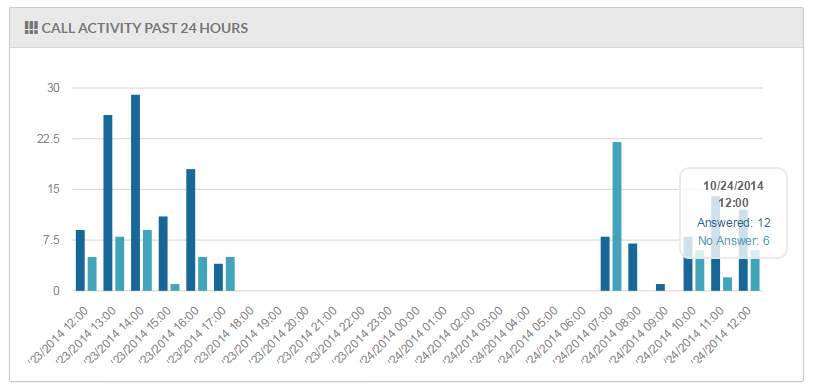
Also listed on the dashboard is a bar chart with the number of total calls (incoming, outgoing, and internal) for the past 24 hours. Hovering over a time on this bar chart shows the number of answered and unanswered calls for that specific hour. For example, hovering over 10:00 AM shows answered/unanswered call statistics for the period between 10:00 AM-10:59 AM.
 Figure 03: Total Calls Bar Chart
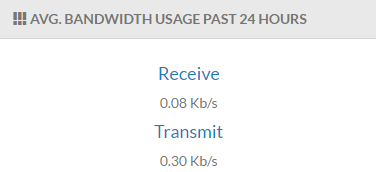
| The final section of the System Health Dashboard displays the average bandwidth usage over the past 24 hours. This usage amount is a running average. All data into and out of the Kerauno server is monitored including phone traffic, downloaded CDRs and recordings, uploaded backup files, etc. |
|


