Navigate to Reporting > Agent Analytics.
Call center managers can view inbound metrics regarding agents across all assigned Ring Groups.
Main Menu:
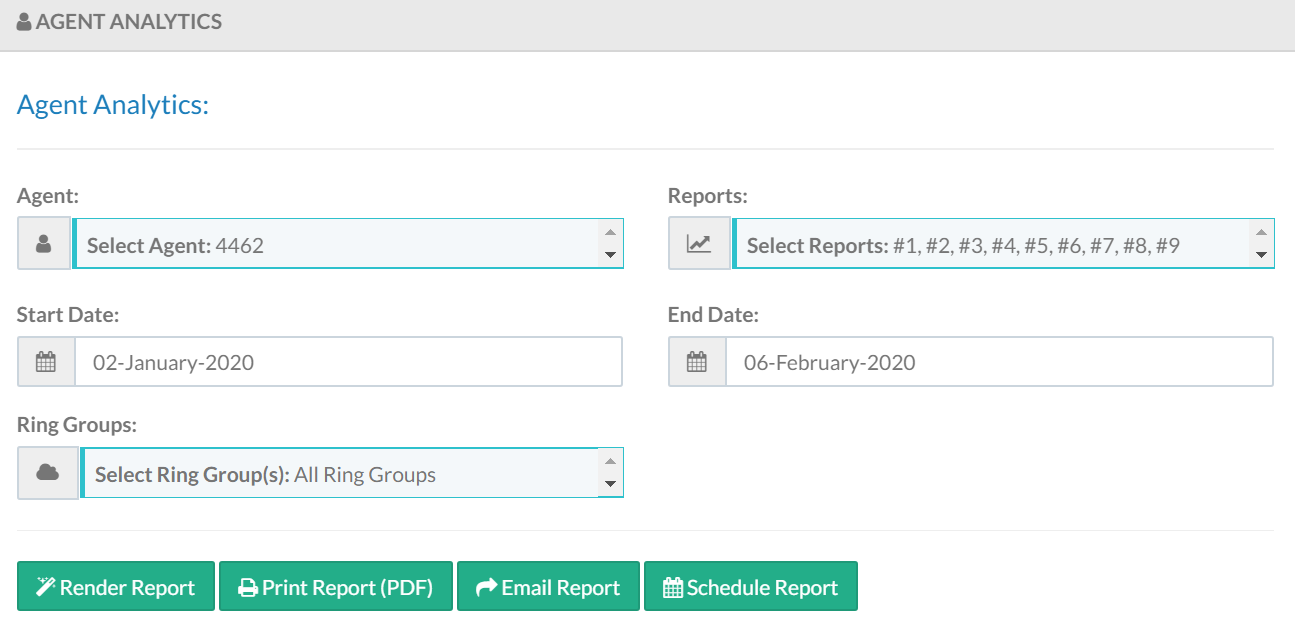
To run a report, select the desired Agent(s) and corresponding Reports.

Populate a Start Date and End Date for the report.

Select Ring Group(s).

Click Render Report once search criteria is populated.

Report results are displayed on screen for each selected report. Export to CSV is available at the top of each individual report as well.
Agent Analytics Reports
There are seven available reports within the Agent Analytics menu. Select desired report(s) or click Select All Reports to return all available data.
- Agent Summary
- Agent Dependability
- Agent Utilization
- Calls Per Hour (CPH)
- Calls Per Day (CPD)
- Average Talk Time (ATT)
- Total Talk Time Per Hour
- Agent Call Details
- Time In Status
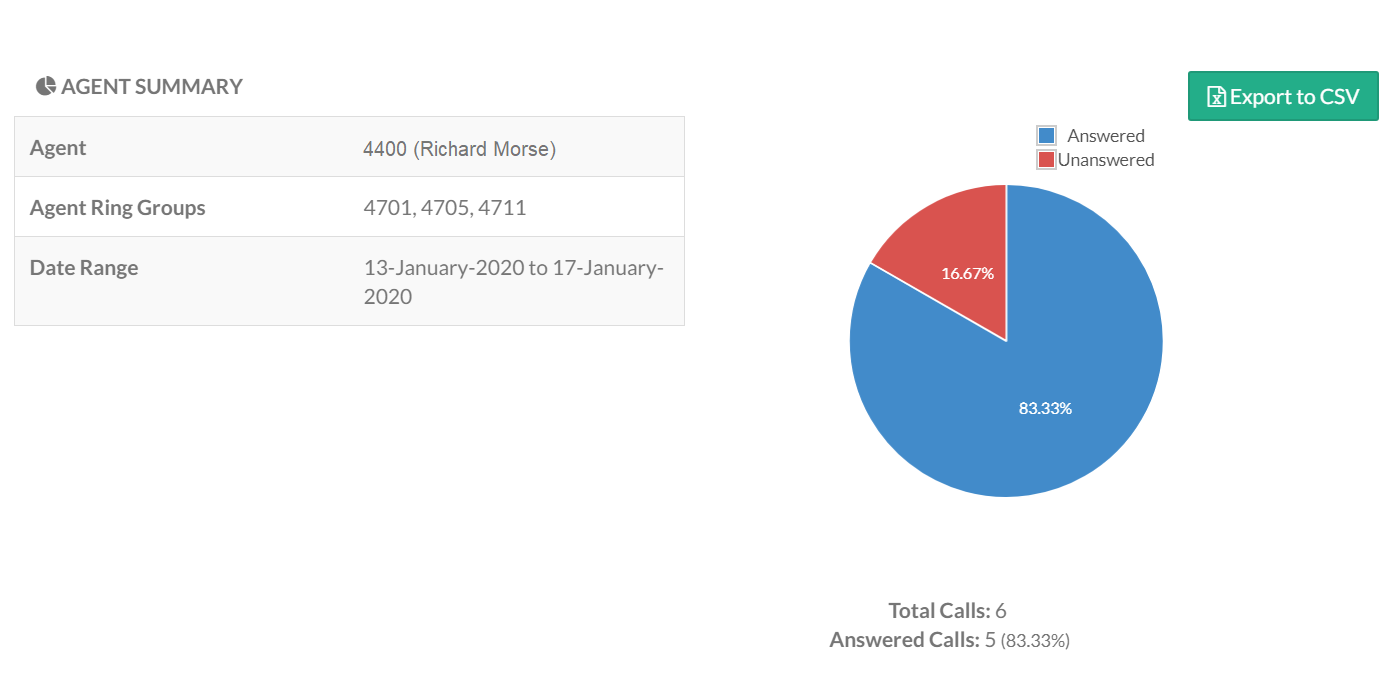
Agent Summary
This report displays the most basic information about an agent:
• Total Calls
• Answered Calls
• Unanswered Calls
Agent Dependability
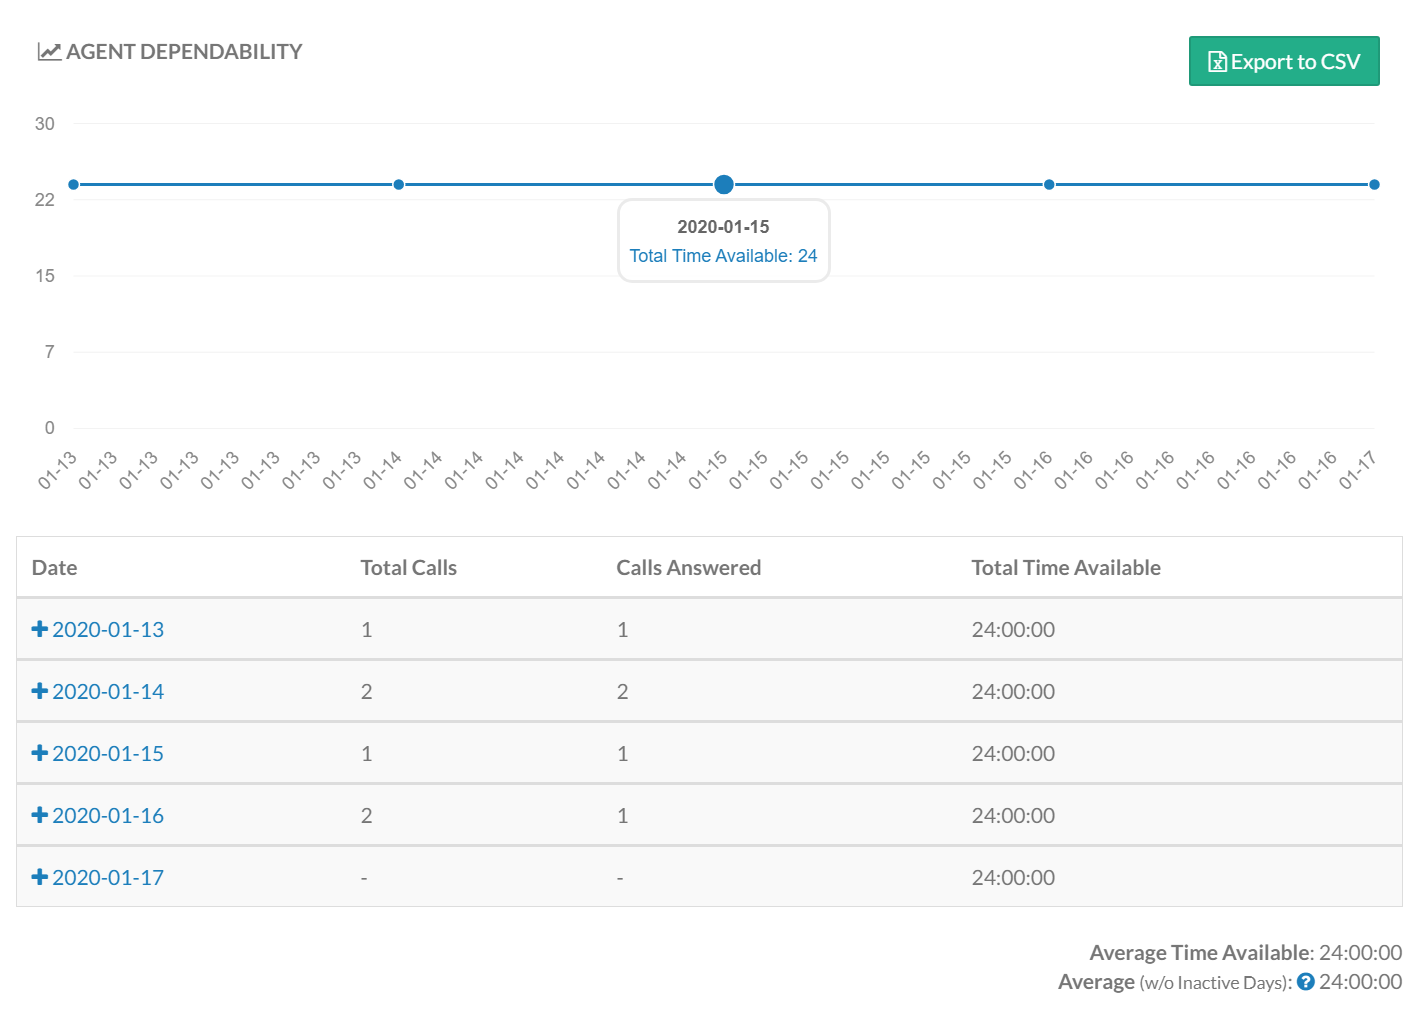
This report displays the total calls, answered calls, and total time available in the Ring Group. Hover over a particular day to view the Total Time Available.
Note: Agents that do not set available hours reflect as available 24 hours per day.
A detailed table displays below the chart sorted by date with the same data. Click the + sign for any given day to view log in, log out, and pause time data. Average Time Available is also displayed and excludes days where no calls occurred.
Agent Utilization
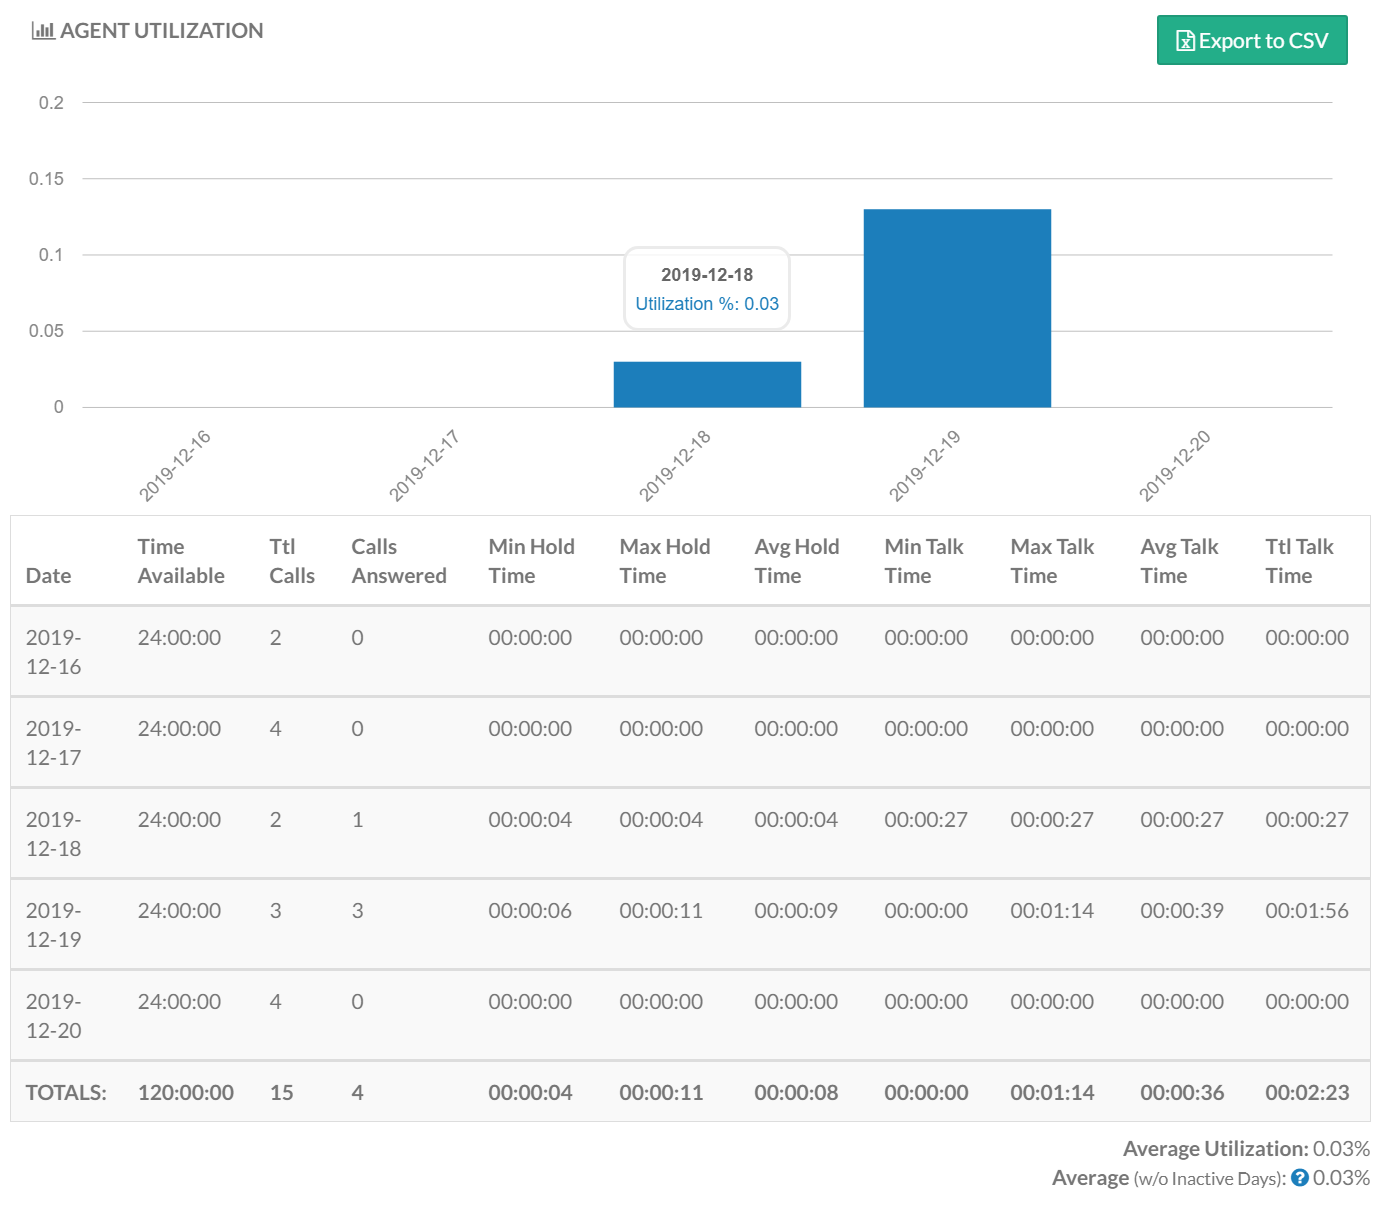
This report displays the agent's Total Talk Time divided by their Time Available in a bar graph (how long the agent was on the phone while in the Ring Group). Hover over a particular day to display the utilization %.
Note: Agents that do not set available hours reflect as available 24 hours per day.
A detailed table displays below the graph with all call statistics. Average Utilization is also displayed and excludes days where no calls occurred.
Calls Per Hour (CPH)
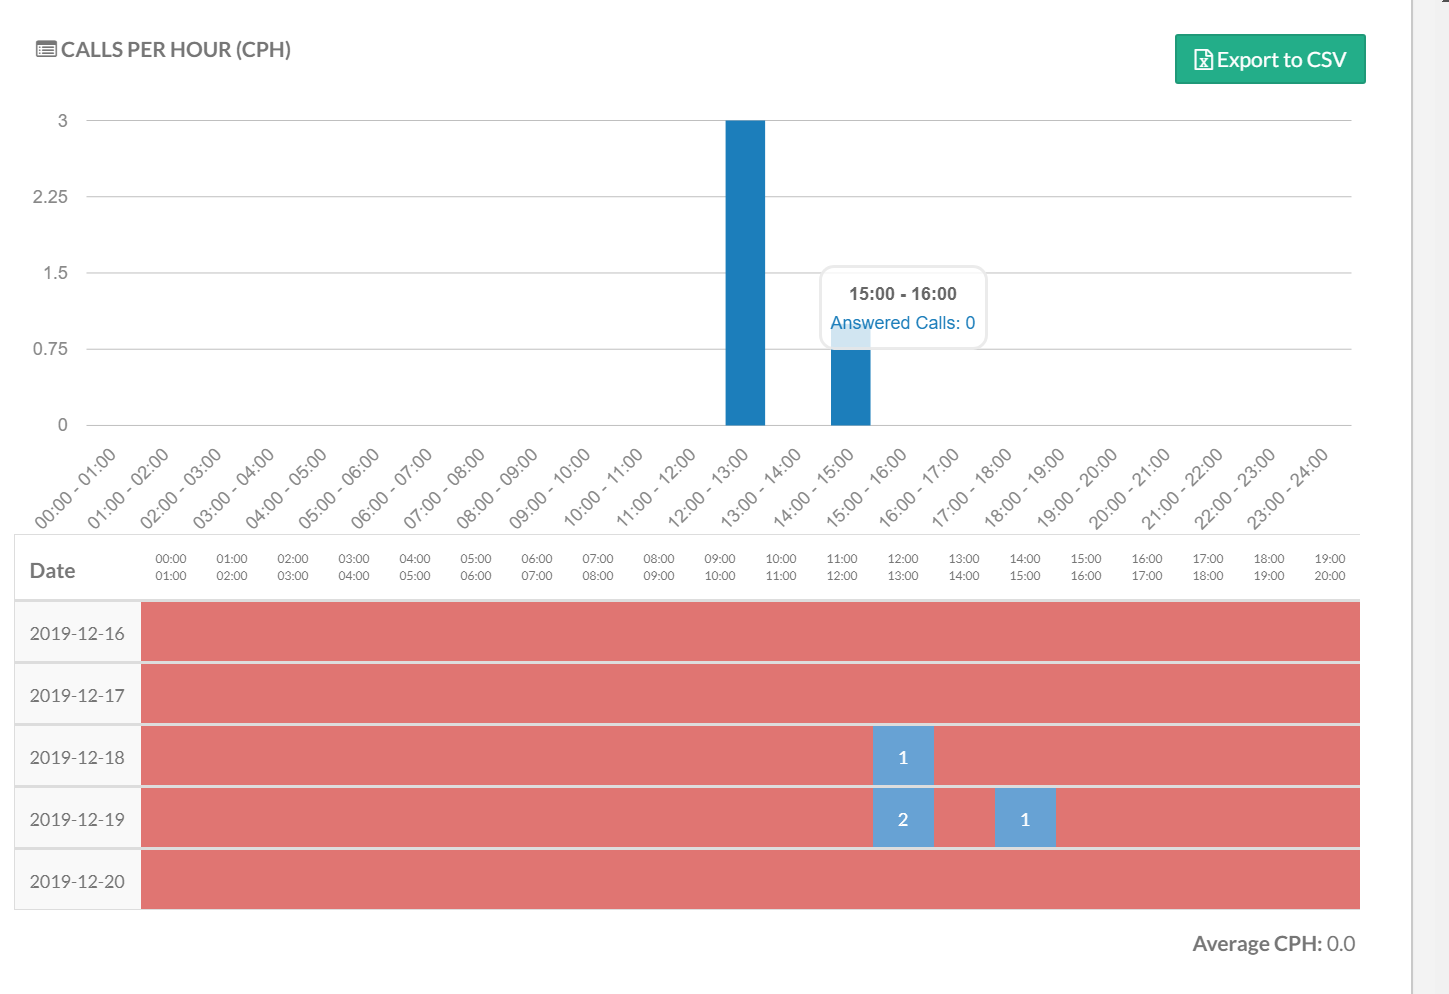
This report displays the number of calls in a bar graph per hour. Hover over a particular time frame to display the total number of answered calls during that interval.
A detailed chart displays below the graph with the number of calls taken by hour by day. Blue reflects active calls during the corresponding hour on the graph. Average Calls Per Hour (CPH) is also displayed and excludes days where no calls occurred.
Calls Per Day (CPD)
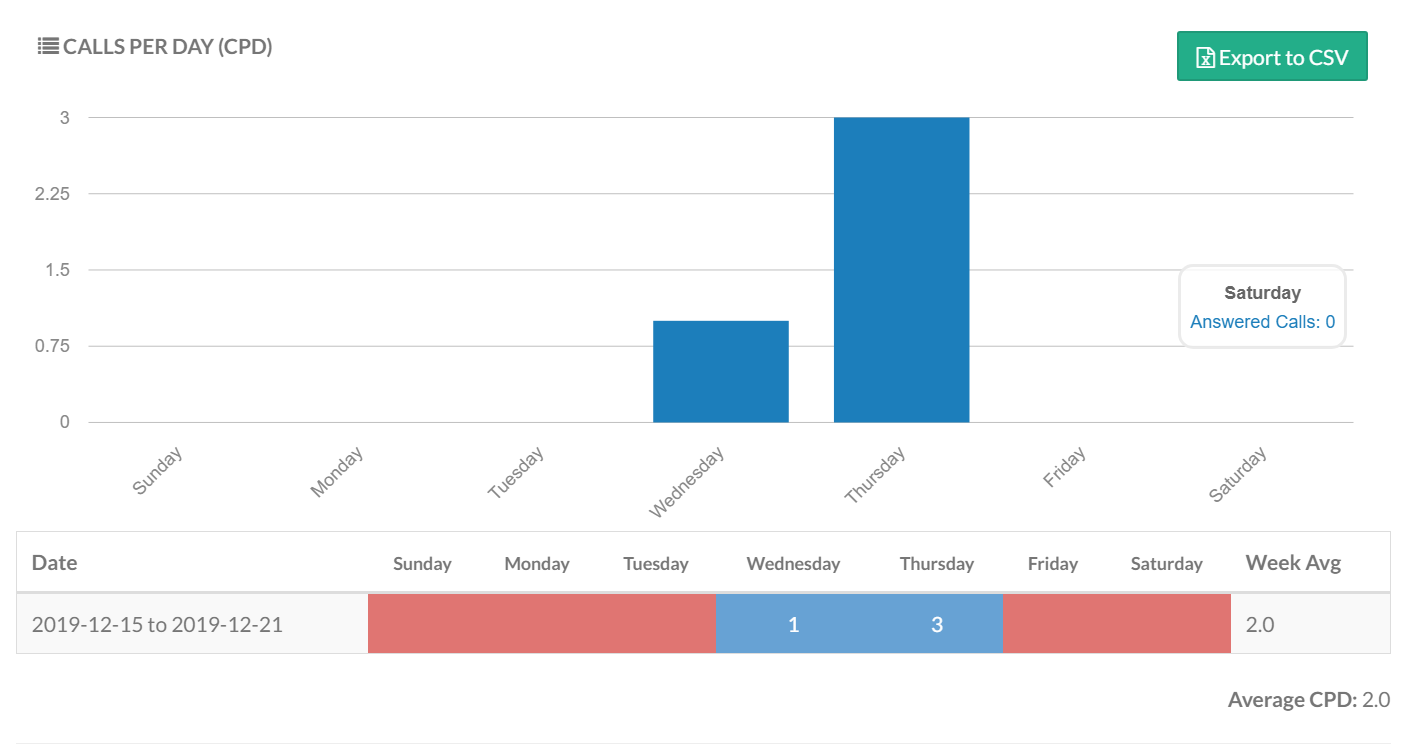
This report displays the number of calls in a bar graph per day. Hover over a particular day to display the total number of answered calls during that interval.
A detailed chart displays below the graph with the number of calls taken by day. Blue reflects active calls during the corresponding day on the graph. Average Calls Per Day (CPD) is also displayed and excludes days where no calls occurred.
Average Talk Time (ATT)
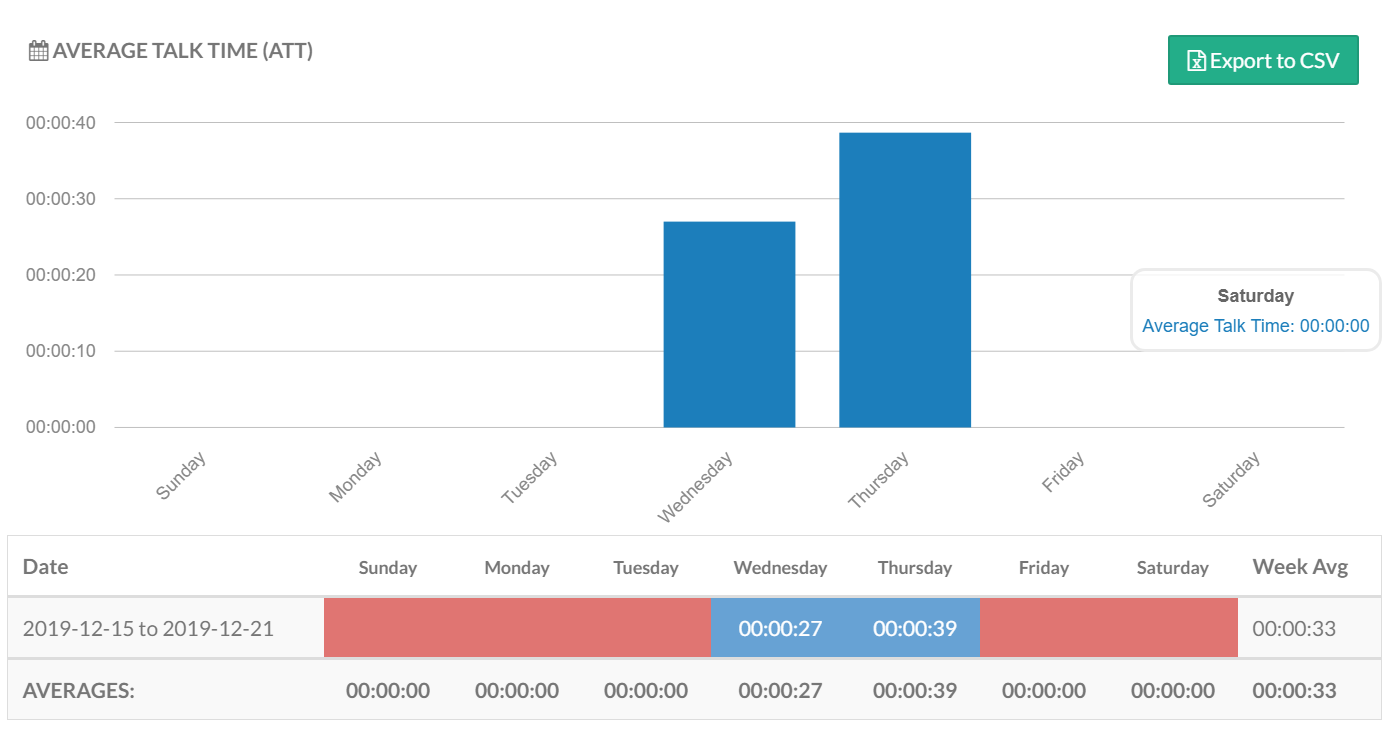
This report displays the average agent talk time by day. A detailed chart displays below the graph with total agent talk time by day. Blue reflects active calls during the corresponding hour on the graph.
A diagram displays below the chart with the average handling time of all calls by day. Blue reflects active calls during the corresponding day on the graph. A weekly talk time average is also displayed.
Total Talk Time Per Hour
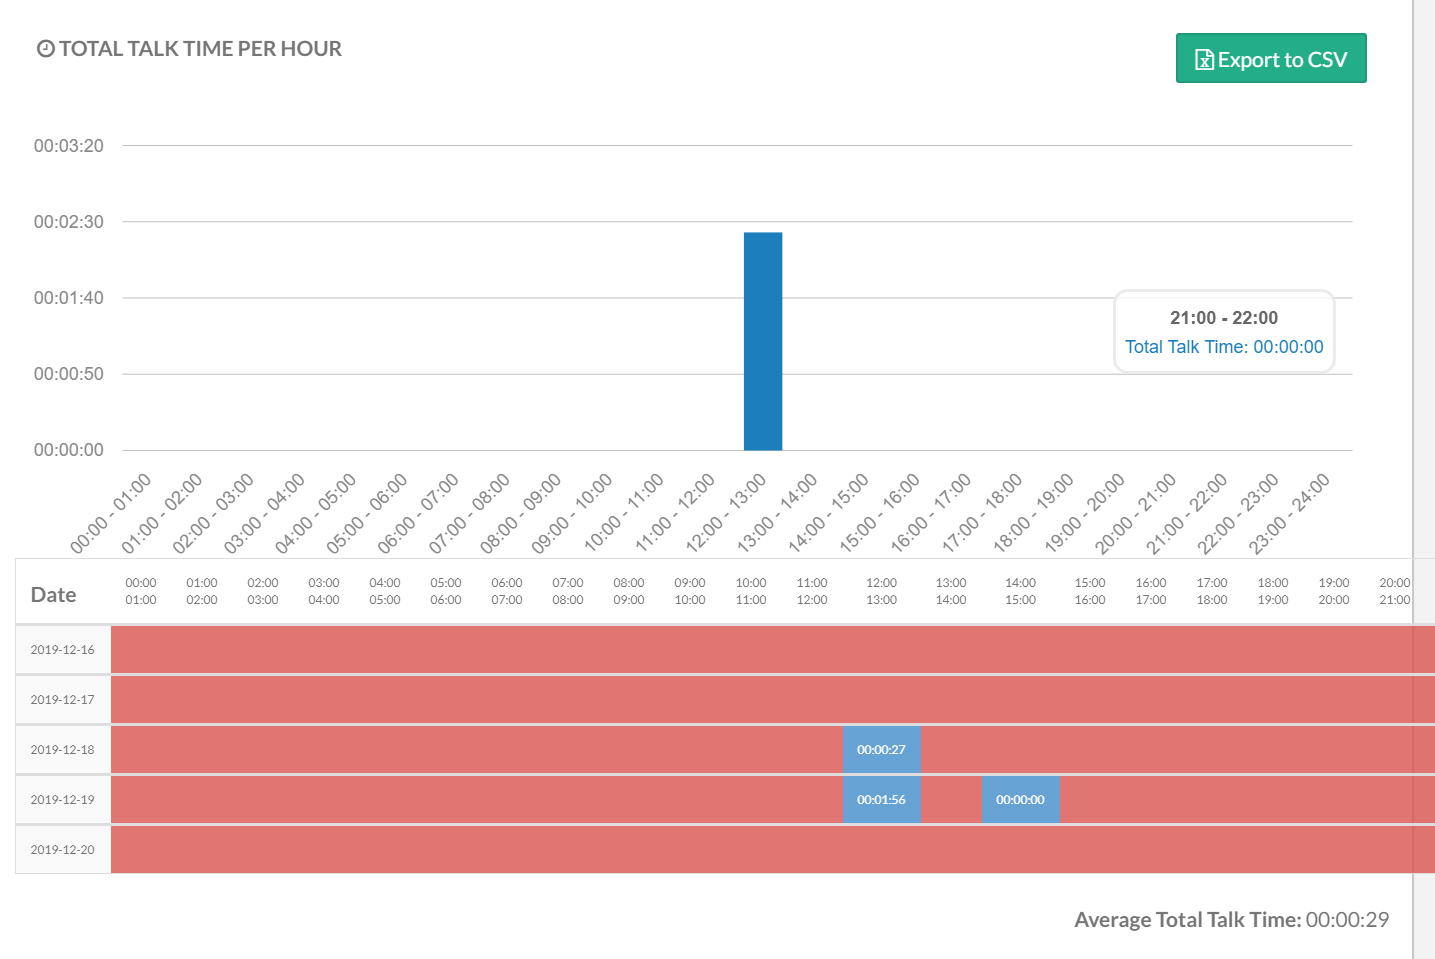
This report displays total talk time in a bar graph per hour. Hover over a particular time frame to display the total talk time.
A detailed chart displays below the graph with total talk time per day. Blue reflects total talk time during the corresponding day on the graph. Average Talk Time is also displayed.
Agent Call Details (Answered Calls)
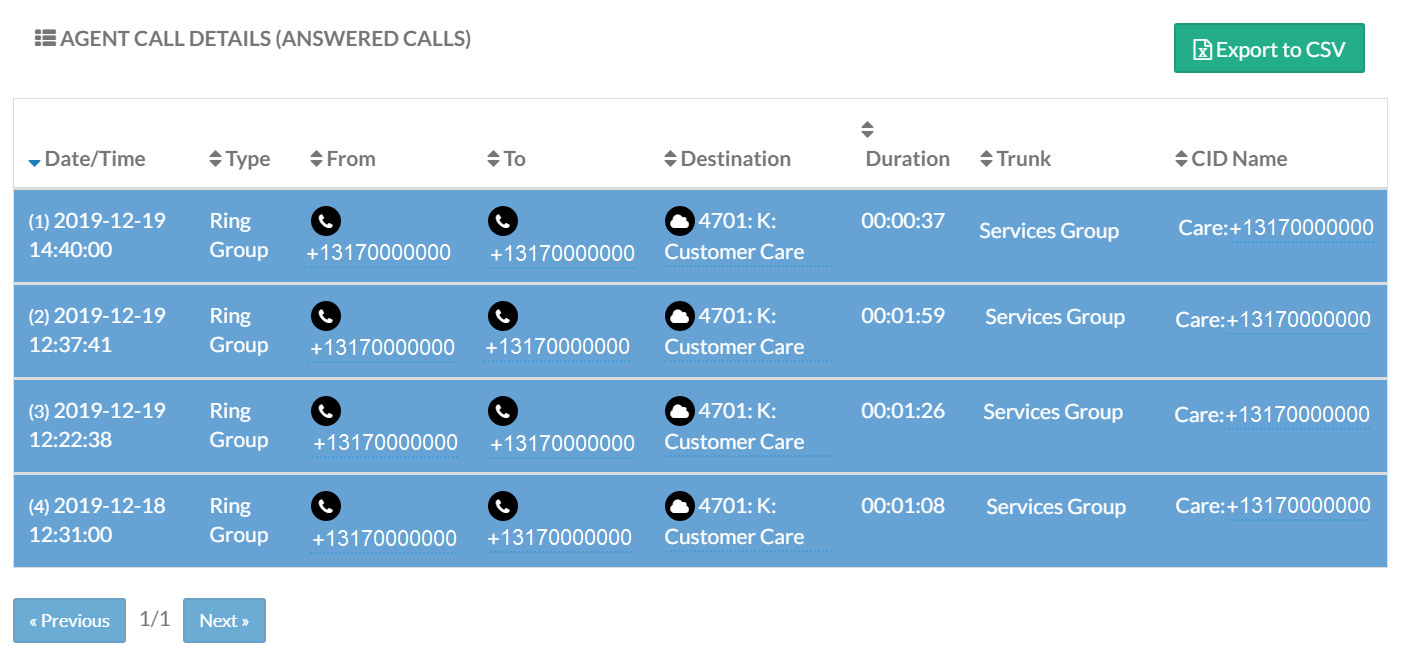
This report displays all available Call Detail Reports (CDRs) for a specific agent. Only answered Ring Group calls by the agent are displayed. Click the Date/Time hyperlink to view In-Call Analytics for a specific call.
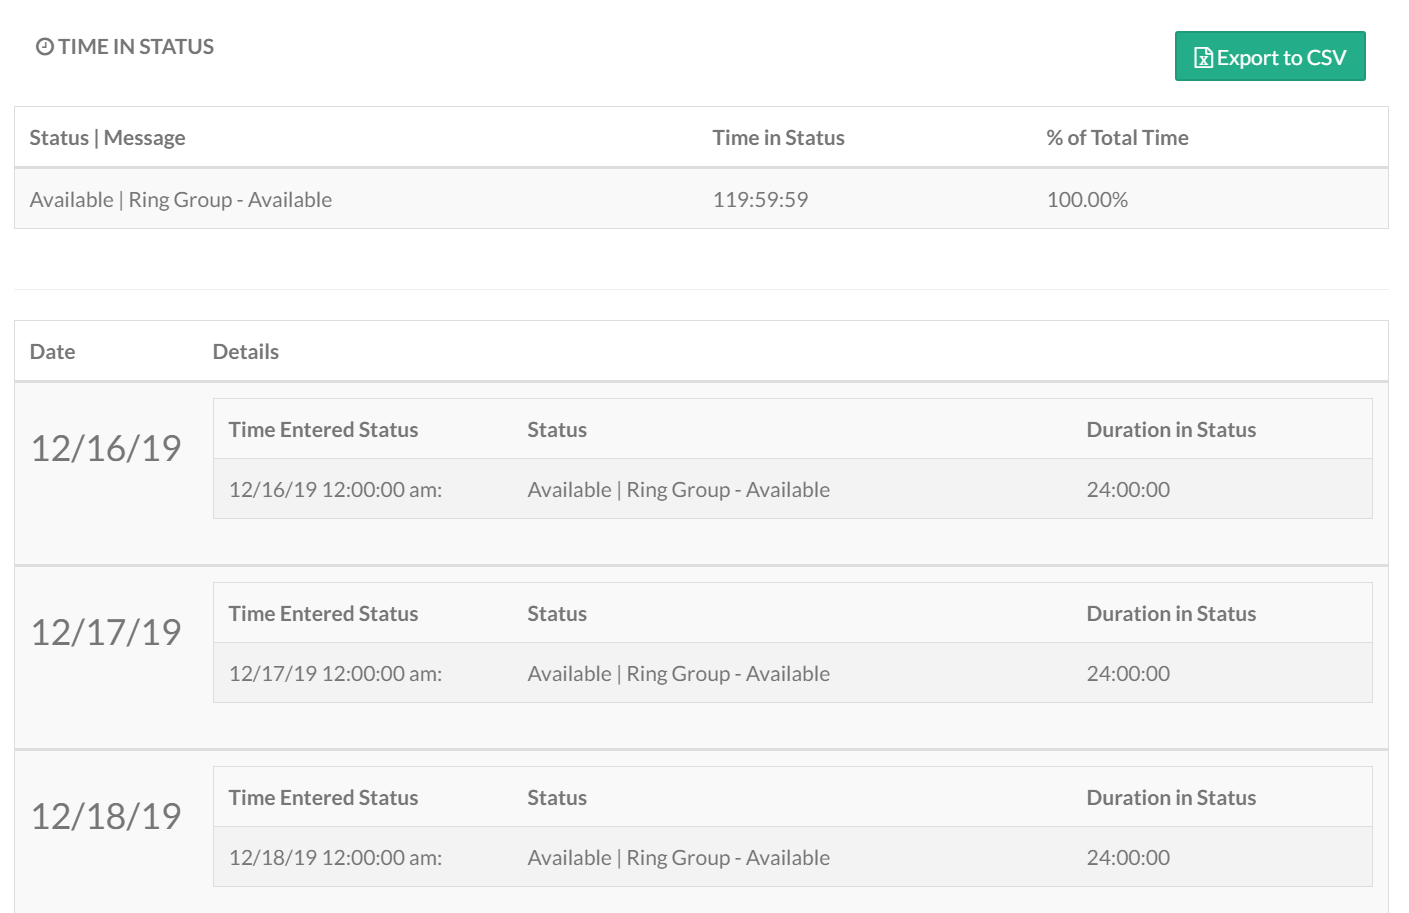
Time In Status
This report displays time spent in each available Agent status.
Note: Agents that do not set available hours reflect as available 24 hours per day.
